【C#】C# Winfrom Chart 图表控件 柱状图、折线图
目录
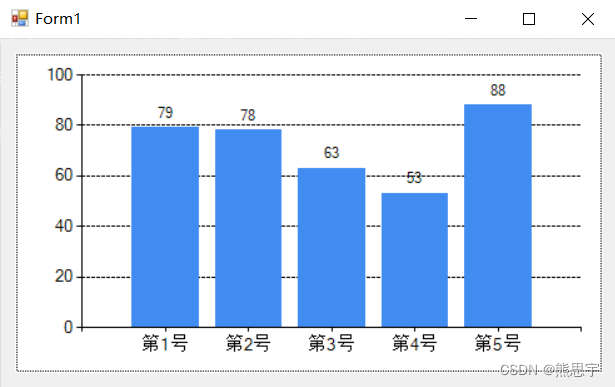
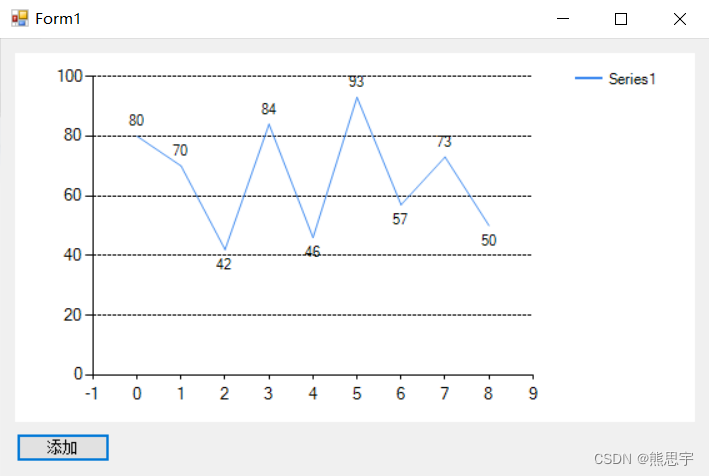
效果:
一、参考
强大的Winform Chart图表控件使用说明 - 走看看
二、柱状图
1.新建项目
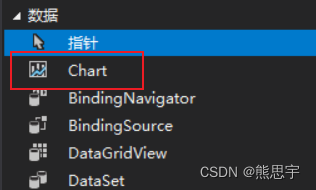
新建一个.NET Framework 类型的 Winfrom 项目,在数据里面找到 Chart 控件,拖入到界面中
如下:
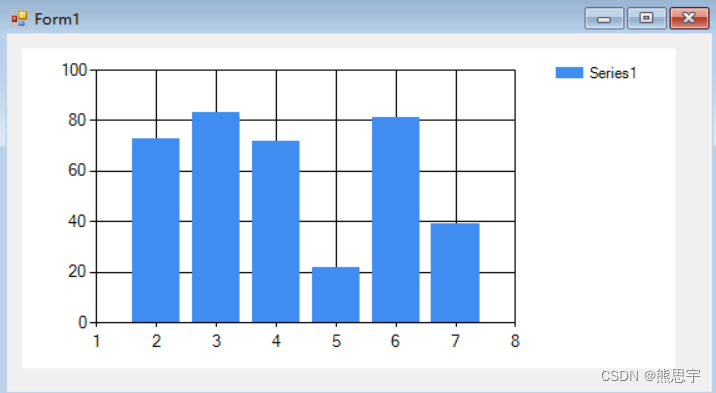
拖入控件时,默认的有一个图表的样式,实际运行其实是一片空白
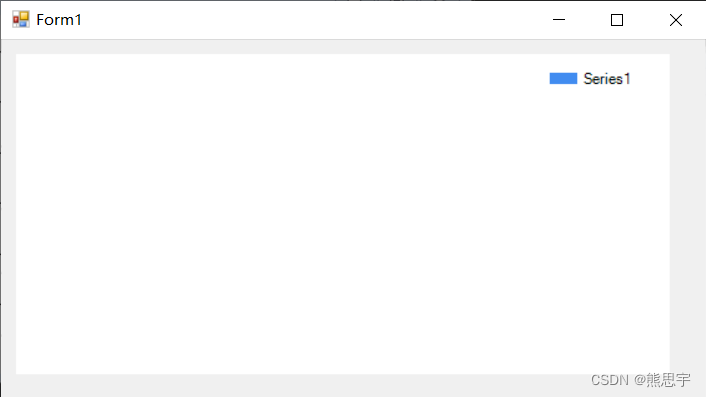
2.修改图表样式
在Series这里,点击集合后面到三个点
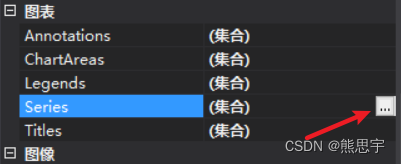
这里可以修改图表的样式,比如柱状图,折线图
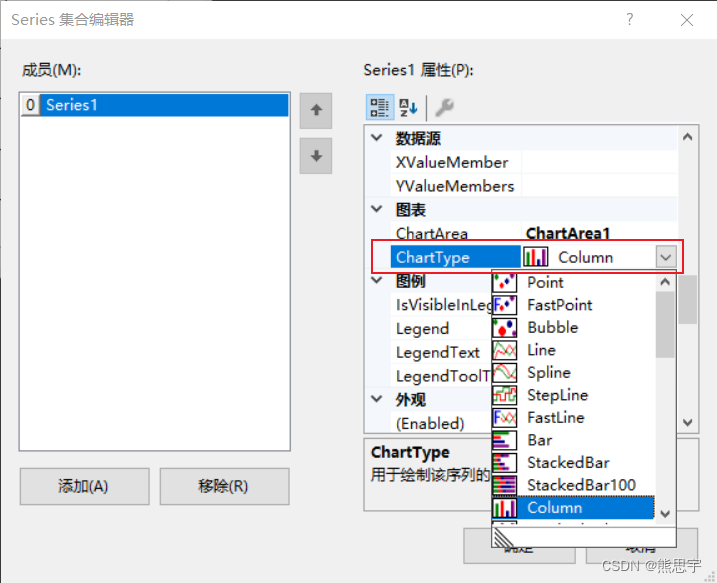
3.绑定数据
此时图表还没有任何数据,可以用绑定方式添加数据,如下
private List<int> XList = new List<int>();
private List<int> YList = new List<int>();
private Random randoms = new Random();

private void Form1_Load(object sender, EventArgs e)
{
    for (int i = 0; i < 6; i++)
    {
        XList.Add(i);
        YList.Add(randoms.Next(10, 100));
    }
    chart1.Series["Series1"].Points.DataBindXY(XList, YList);
}
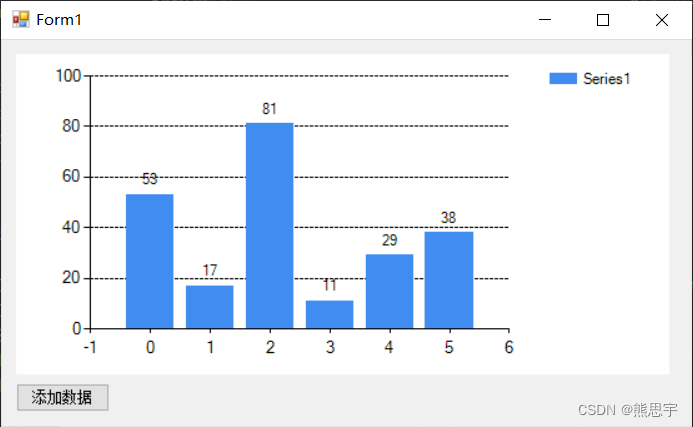
运行后如下
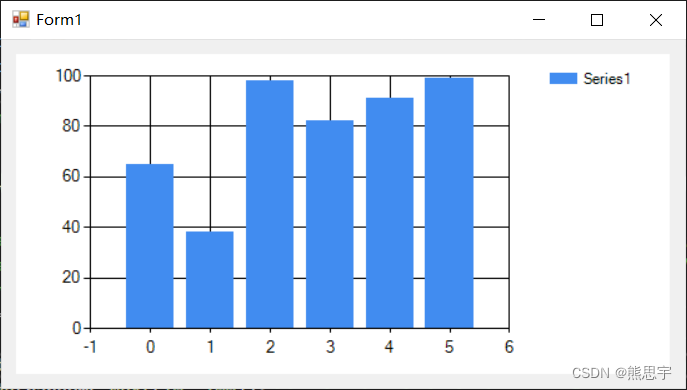
上图有两个问题,
1.柱状图没有显示具体数据,根本看不出来实际数据是多少,
2.背景的网格没有去掉,样式比较难看,
用代码可以解决这两个问题
private List<int> XList = new List<int>();
private List<int> YList = new List<int>();
private Random randoms = new Random();
//private int index = -1;

private void Form1_Load(object sender, EventArgs e)
{
    chart1.ChartAreas[0].AxisX.MajorGrid.LineDashStyle = ChartDashStyle.NotSet; //设置网格类型为虚线
    chart1.ChartAreas[0].AxisY.MajorGrid.LineDashStyle = ChartDashStyle.Dash; //设置网格类型为虚线
    chart1.Series[0].IsValueShownAsLabel = true;//设置显示示数

    for (int i = 0; i < 6; i++)
    {
        XList.Add(i);
        YList.Add(randoms.Next(10, 100));
    }
    //写法同上面到 chart1.ChartAreas[0] 类似
    chart1.Series["Series1"].Points.DataBindXY(XList, YList);
}
效果

此时和我们想要的效果就差不多了
4.删除Series1图例
在图表的右上角有一个方块状的标记,然而我觉得它并没有什么作用,删除的方法有两种
1)使用属性窗体删除
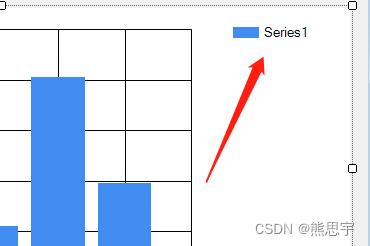
在属性里选择Legends
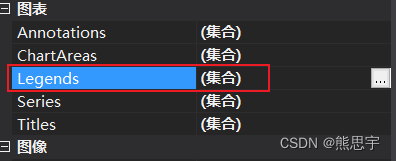
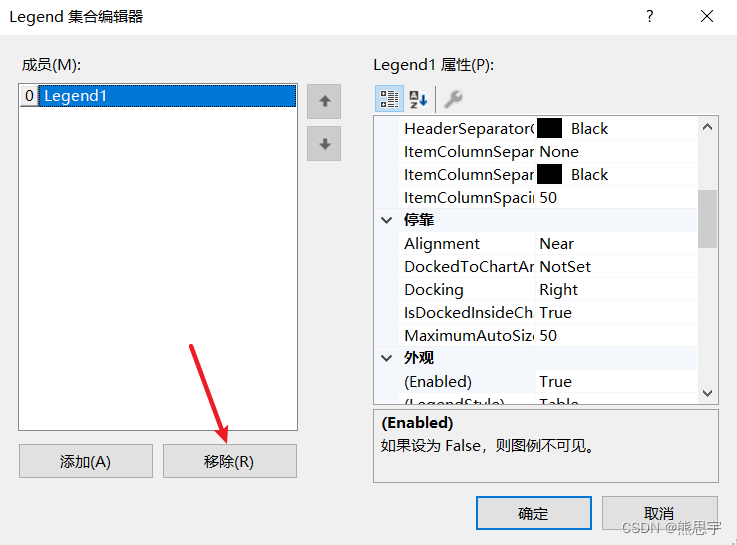
选中Legend1,点击移除即可。
效果
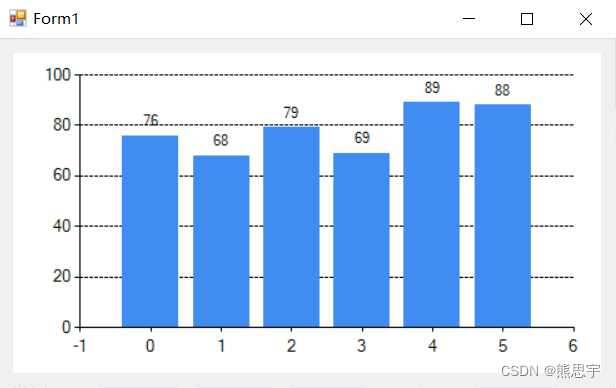
2)使用代码删除
用代码删除的方式如下
chart1.Legends[0].Enabled = false;//取消图例
效果一样
5.自定义X轴的刻度值
1)使用List<string>绑定
在上面的案例中,我们可以看到,x轴显示的都是1,2,3.....按顺序排列的,如果我们想自定义刻度值,要怎么做呢,其实也很简单,绑定一个string类型的值就行了
代码:
using System;
using System.Collections.Generic;
using System.Windows.Forms;
using System.Windows.Forms.DataVisualization.Charting;

namespace 统计图
{
    public partial class Form1 : Form
    {
        public Form1()
        {
            InitializeComponent();
        }

        private List<string> XList = new List<string>();
        private List<int> YList = new List<int>();
        private Random randoms = new Random();

        private void Form1_Load(object sender, EventArgs e)
        {
            chart1.ChartAreas[0].AxisX.MajorGrid.LineDashStyle = ChartDashStyle.NotSet; //设置网格类型为虚线
            chart1.ChartAreas[0].AxisY.MajorGrid.LineDashStyle = ChartDashStyle.Dash; //设置网格类型为虚线
            chart1.Series[0].IsValueShownAsLabel = true;//设置显示示数

            for (int i = 0; i < 5; i++)
            {
                YList.Add(randoms.Next(10, 100));
                XList.Add(string.Format("第{0}号", i + 1));
            }
            chart1.Series["Series1"].Points.DataBindXY(XList, YList);
        }

    }
}
效果:

除此之外,还有另一种方法,那就是使用 LabelStyle.Format 进行自定义
2)使用LabelStyle.Format绑定
先绘制一个如下图所示的图表(在上面的案例中有代码)
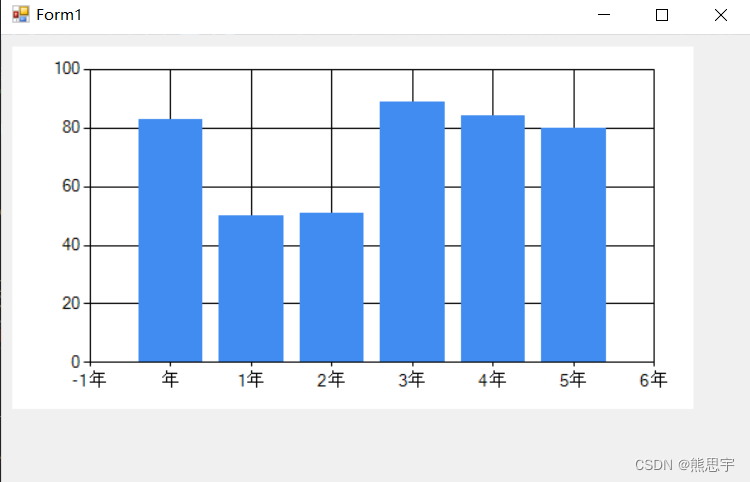
此时想将这些数字改为其他值,只需要加上一句代码
chart1.ChartAreas[0].Axes[0].LabelStyle.Format = "#年"; //设置X轴显示样式
这里的 Axes[0] 效果同 AxesX 一样
chart1.ChartAreas[0].AxisX.LabelStyle.Format = "#年"; //设置X轴显示样式
完整代码:
using System;
using System.Collections.Generic;
using System.Windows.Forms;

namespace 柱状图
{
    public partial class Form1 : Form
    {
        public Form1()
        {
            InitializeComponent();
        }

        private List<int> XList = new List<int>();
        private List<int> YList = new List<int>();
        private Random randoms = new Random();

        private void Form1_Load(object sender, EventArgs e)
        {
            chart1.ChartAreas[0].Axes[0].LabelStyle.Format = "#年"; //设置X轴显示样式

            for (int i = 0; i < 6; i++)
            {
                XList.Add(i);
                YList.Add(randoms.Next(10, 100));
            }
            chart1.Series["Series1"].Points.DataBindXY(XList, YList);
        }

    }
}
效果:
6.自定义Y轴的刻度值
操作和上节中的操作 LabelStyle.Format 一样
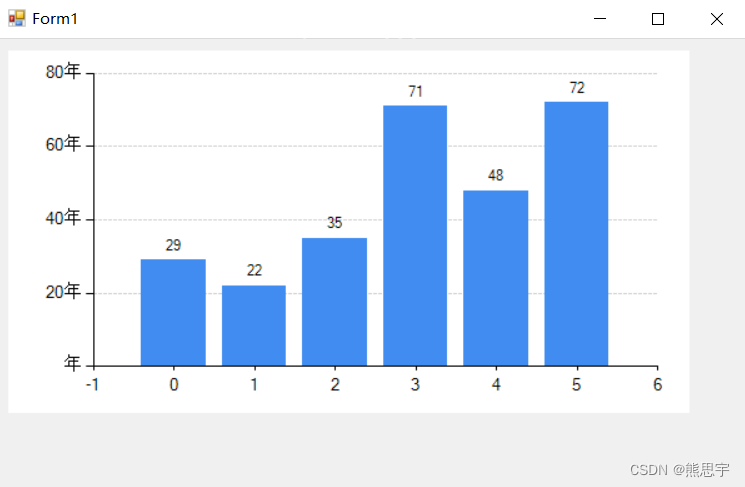
代码:
chart1.ChartAreas[0].AxisY.LabelStyle.Format = "#年";
效果:
7.X轴刻度值显示不全的解决方法
当X轴刻度值过于密集的时候,就会出现有部分显示不出来,如图

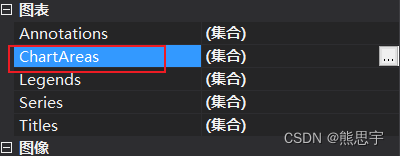
打开图表的 ChartAreas 集合
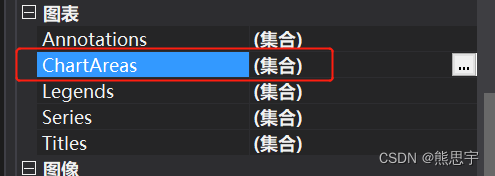
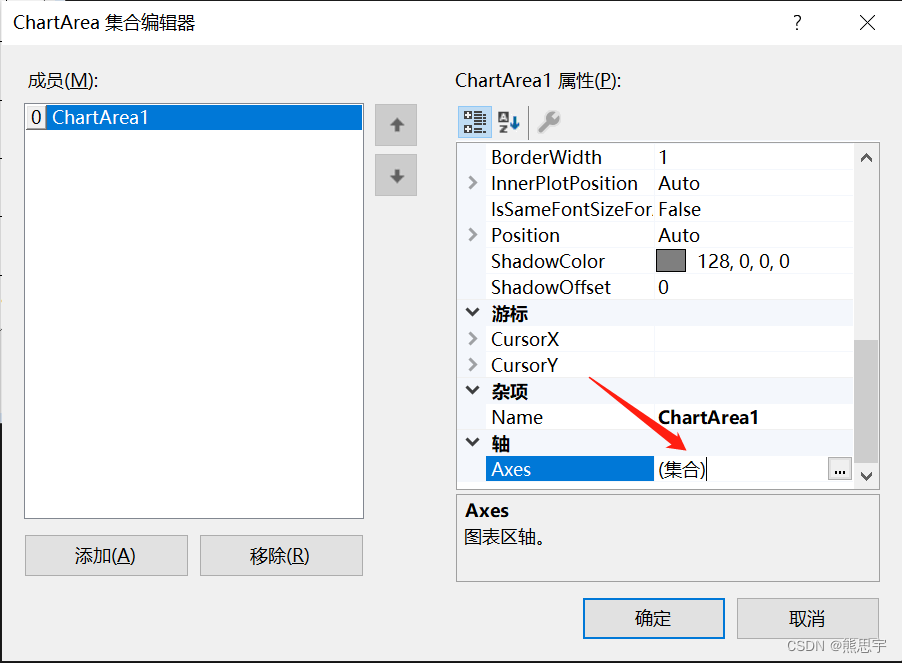
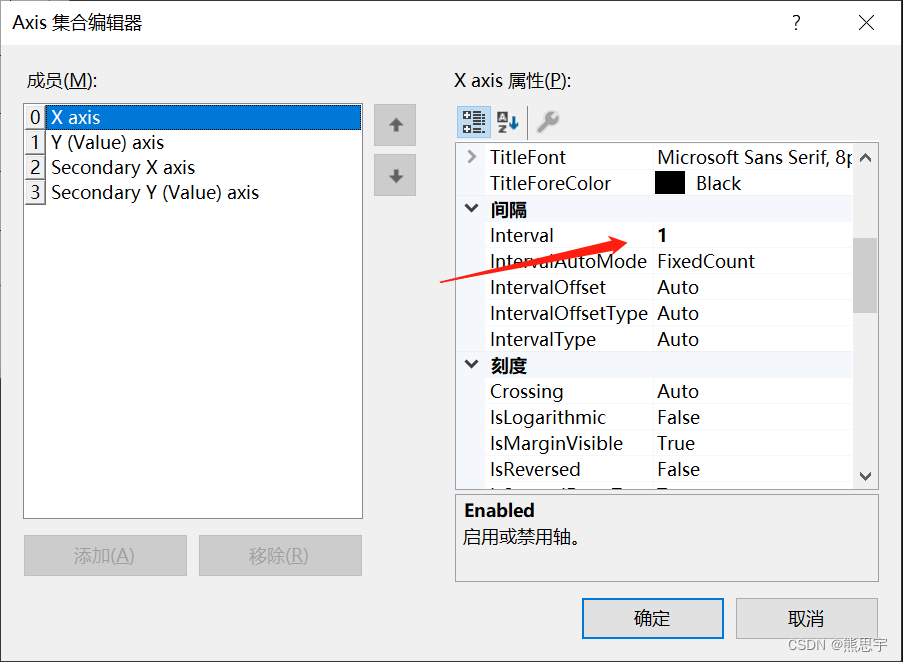
将间隔中的Interval 设置为1
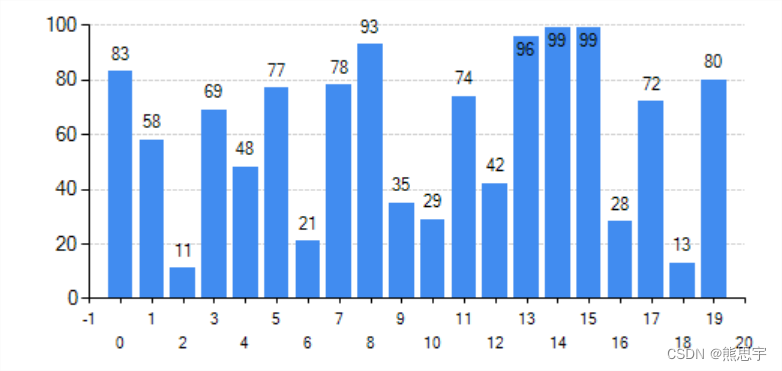
效果:
8.修改X Y刻度值的字体样式

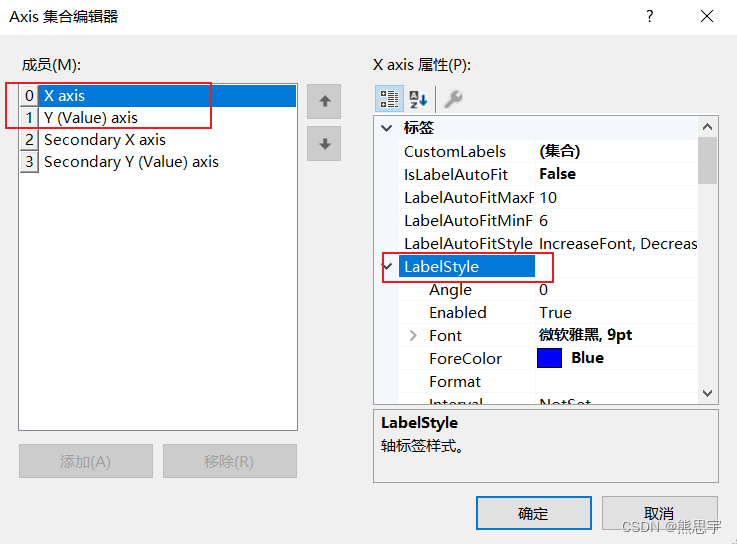
在成员这里可以选择要修改X,或者Y轴的值,对应的 axis属性里 LabelStyle 里面就有非常多详细的属性了
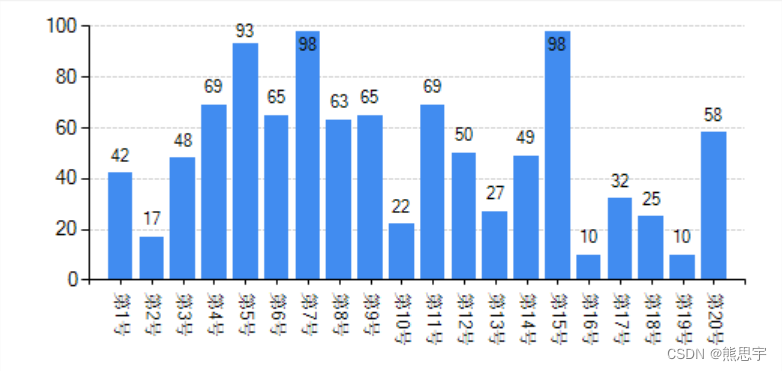
9.X轴刻度值旋转90°
根据上节操作打开 X axis 中的 LabelStyle,将 Angle 设置为90
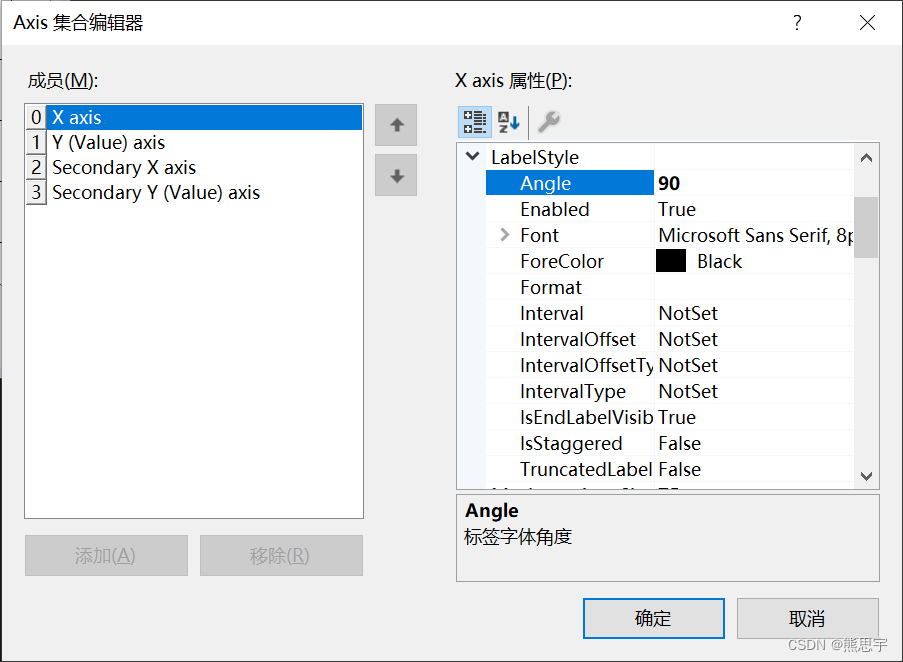
效果
完整代码
using System;
using System.Collections.Generic;
using System.Windows.Forms;

namespace 柱状图
{
    public partial class Form1 : Form
    {
        public Form1()
        {
            InitializeComponent();
        }

        private List<string> XList = new List<string>();
        private List<int> YList = new List<int>();
        private Random randoms = new Random();

        private void Form1_Load(object sender, EventArgs e)
        {
            chart1.ChartAreas[0].AxisX.MajorGrid.LineDashStyle = System.Windows.Forms.DataVisualization.Charting.ChartDashStyle.NotSet;//设置网格线型为不显示
            chart1.ChartAreas[0].AxisY.MajorGrid.LineDashStyle = System.Windows.Forms.DataVisualization.Charting.ChartDashStyle.Dash;//设置网格线型为虚线
            chart1.ChartAreas[0].AxisY.MajorGrid.LineColor = System.Drawing.Color.LightGray;//网格线的颜色
            chart1.Series[0].IsValueShownAsLabel = true;//设置显示示数

            for (int i = 0; i < 20; i++)
            {
                YList.Add(randoms.Next(10, 100));
                XList.Add(string.Format("第{0}号", i + 1));
            }
            chart1.Series["Series1"].Points.DataBindXY(XList, YList);
        }
    }
}
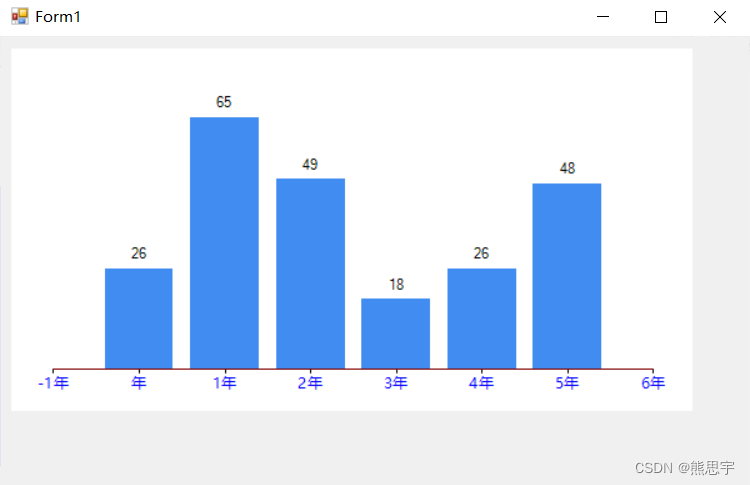
10.禁用Y轴刻度线
Y轴的边框有时候感觉真的有点丑,其实也是可以去掉的

按照上面步骤8打开 Axis 集合编辑器,选择 Y(Value) axis,将 Enabled 设置为 false 即可。
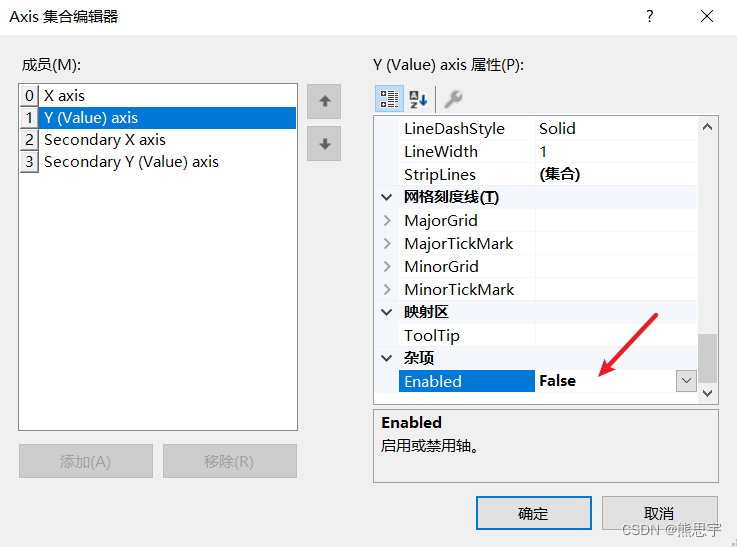
效果:
11.去掉Y轴刻度值
按照上节的步骤禁用了整个Y轴后,发现Y轴的刻度线没了,背景的虚线也没了,如果你还是需要这些样式的话,还是有办法的,就是将刻度值颜色设置成背景颜色一致,那么就看不到了
//chart1.ChartAreas[0].AxisY.LineColor = System.Drawing.Color.White;//Y轴线白色
chart1.ChartAreas[0].AxisY.LabelStyle.ForeColor = System.Drawing.Color.White;//刻度值颜色
chart1.ChartAreas[0].AxisY.MajorTickMark.Enabled = false;//隐藏刻度线
效果:
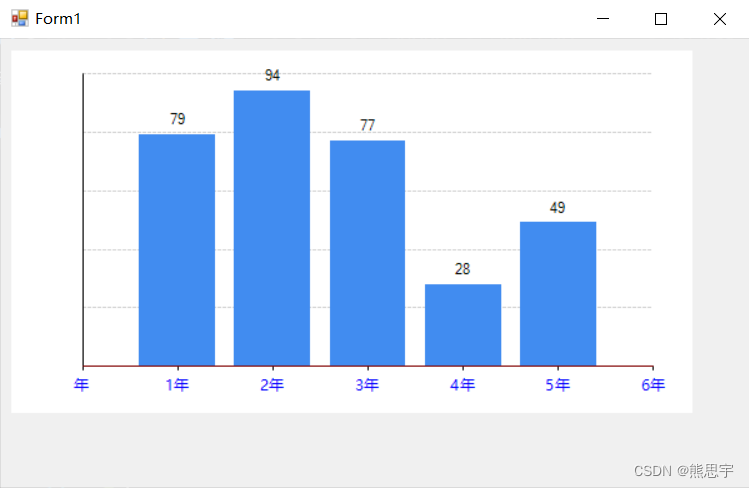
左边这里有点空白,可以将整个图表控件的坐标向左边移动一点。
12.改变柱子的宽度
柱子的宽度是根据柱子的数量和控件的宽度决定的,如果柱子宽度过大要怎么解决呢
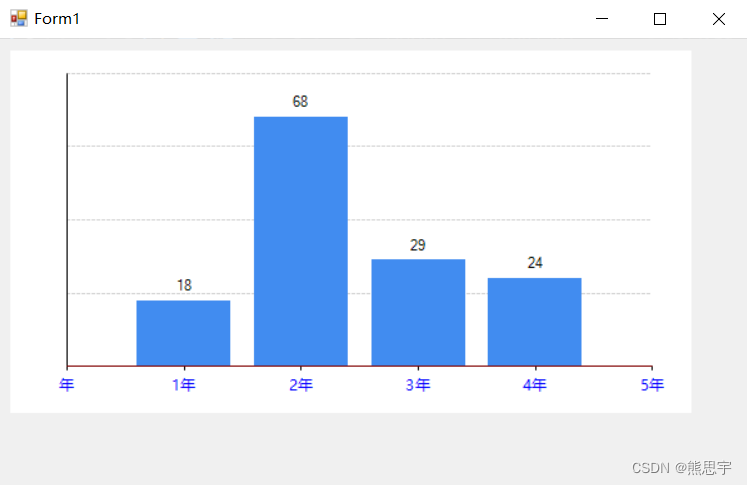
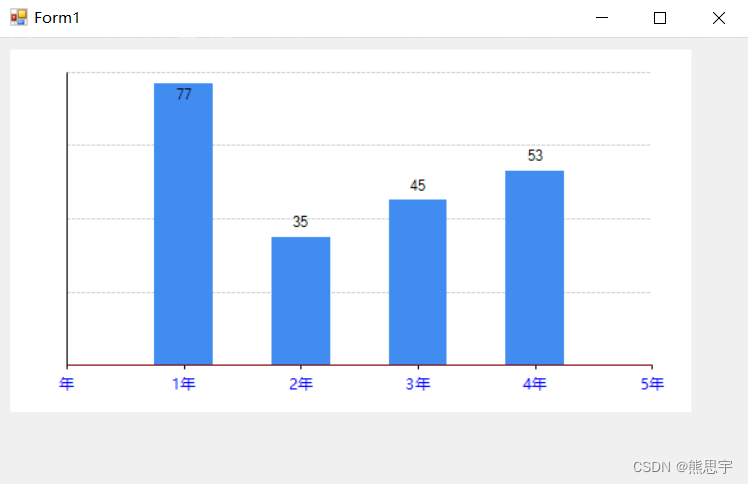
加入代码:
chart1.Series[0]["PointWidth"] = "0.5";//宽度chart1.ChartAreas[0].AxisX.IsMarginVisible = true;//表格开始和末尾添加一个空格
效果:
13.设置网格线的颜色
在上节中的图表可以看到灰色的虚线,看起来还行,代码如下
chart1.ChartAreas[0].AxisY.MajorGrid.LineColor = System.Drawing.Color.LightGray;//网格线的颜色
14.设置网格线的线型
代码如下
//设置网格线型为不显示
chart1.ChartAreas[0].AxisX.MajorGrid.LineDashStyle = System.Windows.Forms.DataVisualization.Charting.ChartDashStyle.NotSet;
//设置网格线型为虚线
chart1.ChartAreas[0].AxisY.MajorGrid.LineDashStyle = System.Windows.Forms.DataVisualization.Charting.ChartDashStyle.Dash;
线型官方枚举的定义
    //
    // 摘要:
    //     指定线型。
    public enum ChartDashStyle
    {
        //
        // 摘要:
        //     不设置线型。
        NotSet = 0,
        //
        // 摘要:
        //     虚线。
        Dash = 1,
        //
        // 摘要:
        //     由重复的点划线图案构成的直线。
        DashDot = 2,
        //
        // 摘要:
        //     由重复的双点划线图案构成的直线。
        DashDotDot = 3,
        //
        // 摘要:
        //     由重复的点图案构成的直线。
        Dot = 4,
        //
        // 摘要:
        //     实线。
        Solid = 5
    }
三、折线图
1.图表设置
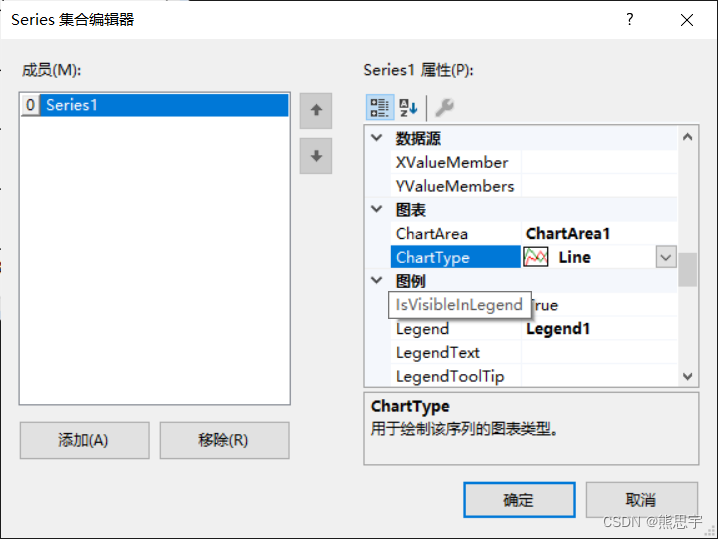
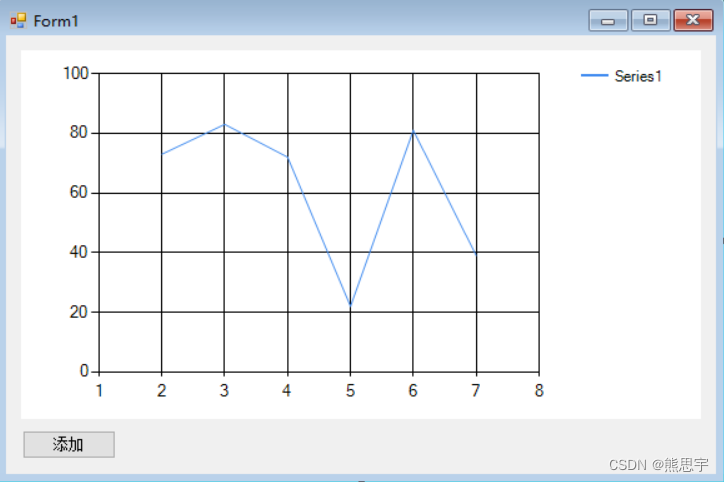
新建一个.NET Framework 类型的 Winfrom 项目,操作同上面一致,将 ChartType 这里设置成 Line,并且在Form1界面中添加一个按钮
运行以后,图表依然是一片空白
2.绑定数据
添加代码
using System;
using System.Collections.Generic;
using System.Windows.Forms;
using System.Windows.Forms.DataVisualization.Charting;

namespace 折线图
{
    public partial class Form1 : Form
    {
        public Form1()
        {
            InitializeComponent();
        }

        private List<int> XList = new List<int>();
        private List<int> YList = new List<int>();
        private Random randoms = new Random();
        private int index = -1;

        private void Form1_Load(object sender, EventArgs e)
        {
            chart1.ChartAreas[0].AxisX.MajorGrid.LineDashStyle = ChartDashStyle.NotSet; //设置网格类型为虚线
            chart1.ChartAreas[0].AxisY.MajorGrid.LineDashStyle = ChartDashStyle.Dash; //设置网格类型为虚线
            chart1.Series[0].IsValueShownAsLabel = true;//设置显示示数
        }

        private void button1_Click(object sender, EventArgs e)
        {
            index++;
            XList.Add(index);
            YList.Add(randoms.Next(10, 100));
            //chart1.Series[0].Points.AddXY(index, randoms.Next(10, 100));
            chart1.Series[0].Points.DataBindXY(XList, YList);
        }
    }
}
运行后,点击添加按钮,效果如下:
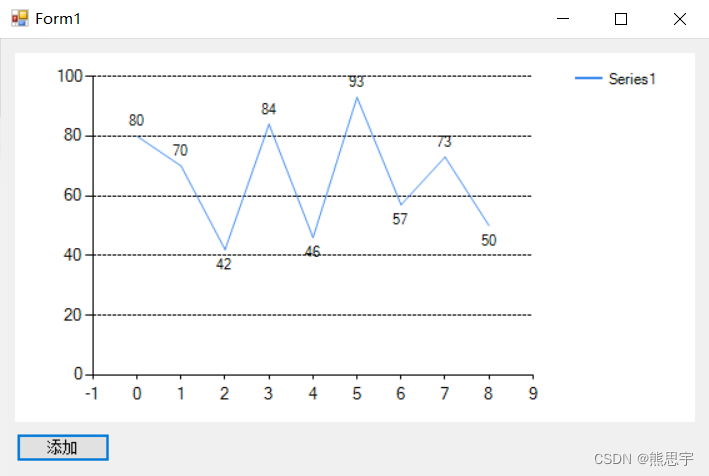
这里你会发现一个问题,图中到93这个点,已经跑到顶部了,字都被挡了一半 ,这里可以用代码设置,比如,遍历整个Y轴的值,然后计算出最大值和最小值,并给chart1的Maximum,Minimum赋值,就可以让折线图居中了
chart1.ChartAreas[0].AxisY.Maximum = 200;
如果你想要下面的效果,也可以参考我的帖子,有需要的可以支持一下我了,谢谢。
C# System.Windows.Forms.DataVisualization Demo案例_熊思宇的博客-CSDN博客_c# system.windows.forms

源码下载:点击下载
结束
如果这个帖子对你有用,欢迎 关注 + 点赞 + 留言,谢谢
end
猜你喜欢
- 【C#】C# Winform Label 控件
- 目录一、概述二、基本用法1.控件内容显示2.控件的外观3.自定义控件的大小4.控件的内边距 5.设置文本的固定位置6.控件的事件结束一、概述Label 控件是 winform 开发中最常用的一个控件,一般用做显示文本,也有时用做打开链接等操作。二、基本用法新建一个 winform 项目,点击 form1 界面,找到工具箱,在工具箱里找到 Label ,拖入到界面即可。1.控件内容显示label 拖入界面中,如下,单击在属性界面就能看到具体的控件属性在这里有两个重要的属性:1.Name在
- 【C#】C# Winform GDI+ 绘图
- 目录一、概述二、绘图1.画直线2.画矩形3.画圆、圆弧4.画扇形5.画多边形6.绘制字符串7.填充图形结束一、概述Graphics类是GDI+技术的一个基本类。GDI+(Graphics Device Interface)是.NET框架的重要组成部分,提供对二维图形图像和文字排版处理的支持。GDI+相关的类分布在下列命名空间中: System.Drawing:提供了最基本的绘图功能(比如画直线、矩形、椭圆等); System.Drawing.Drawing2D: 提供了高级的二维和矢量绘图功能(
- 【C#】从零开始用C#写一个桌面应用程序(二)一个表白程序
- 恶搞表白小程序如何添加按钮,如何添加属性和事件请移步前文。基础操作第一步:新建窗口 在工具箱内找到label和button,拖到form上,设置它们的size属性,autosize属性,text属性。第二步:添加事件为了实现我们的效果,需要给三个按钮分别设计点击事件,鼠标移入事件,鼠标点下事件。分别为click,mouseenter,mousedown事件。第三步:实现移动逻辑this获取form对象,clientsize获取实时大小,使用随机数值,设置对应按钮位置。将对应
- 【C#】C# Winform 配置文件App.config
- 目录一、简介二、添加引用 三、添加节点1.普通配置节点2.数据源配置节点四、管理类 ConfigHelper.cs1.获取配置节点2.更新或加入配置节点结束一、简介在C#中,配置文件很常用,ASP.NET 和 Winform 名称不同,用法一样,如下图config 文件通常用来存储一些需要修改的数据,比如用户名密码,连接数据库的IP地址等,而不是在代码中写死。有人可能会问,那我自己自定义一个配置文件也行,为什么要用它这个?区别当然有,微软自己封装的读取和写入会更简单一些,你自己封装的,
- 【C#】C#二分查找(迭代与递归)
- 二分搜索被定义为一种在排序数组中使用的搜索算法,通过重复将搜索间隔一分为二。二分查找的思想是利用数组已排序的信息,将时间复杂度降低到O(log N)。二分查找算法示例 何时在数据结构中应用二分查找的条件: 应用二分查找算法: 1、数据结构必须是有序的。 2、访问数据结构的任何元素都
- 【C#】C# Winform 三层架构
- 一、介绍三层架构是 C# 桌面开发中比较常用的框架,是由 表示层(UI)、业务逻辑层(BLL)和数据访问层(DAL)三层架构组成,目的是为了 “高内聚,低耦合”。开发人员分工更明确,将精力更专注于应用系统核心业务逻辑的分析、设计和开发,加快项目的进度,提高了开发效率,有利于项目的更新和维护工作。从三层架构可以看到,很类似于 Web 前端开发的 MVC 框架(视图View,模型Model,控制Contorller),但本质上也有不同的地方,比如都有视图(三层中叫 UI),Mod
- 【C#】C#调用win10系统自带软键盘的方法
- 上次做了个笔记是关于调用windows系统自带的触摸键盘的方法:C#调用Windows系统自带触摸键盘的方法_c# 虚拟键盘-CSDN博客除了调用触摸键盘,我们也可以通过调用win10的自带软键盘作为输入途径。方法很简单。1、添加using System.Diagnostics引用。2、创建进程Process Winvirkey = Process.Start("osk.exe");3、打开键盘:Winvirkey = Process.Start("osk.exe&
- 【C#】C#实现Excel合并单元格数据导入数据集
- 目录功能需求Excel与DataSet的映射关系范例运行环境Excel DCOM 配置设计实现组件库引入方法设计返回值 参数设计打开数据源并计算Sheets拆分合并的单元格创建DataTable将单元格数据写入DataTable总结功能需求将Excel里的worksheet表格导入到DataSet里,是项目应用里常用的一种操作。一般情况下,worksheet是一个标准的二维数组,如下图:我们可以效仿 MS SQL SERVER 的一些基本导入选项,如首行是否包含数据,要导入哪个Shee
